07 / Splitline field manual
Visualize and verify row data
Create an interactive local chart from JSONL, CSV, or TSV, refine it with plain-language controls, and trace a pinned claim to exact source rows.
Updated
Create a local starter
Open a JSONL, CSV, or TSV file, then choose Visualize immediately after Rows. Visualize does not require a model connection.
-
Choose Create suggested view
Splitline uses profiles already in memory and sends nothing. It chooses the first populated string, number, or boolean field with 2–12 distinct loaded values for a count bar. Otherwise it uses the first numeric field for a 20-bucket histogram, then falls back to a table over the first six profile fields.
-
Read why the field was selected
The workspace names the exact rule and field. This explicit action is the only path that selects a field automatically.
-
Check the provenance
Local suggestion means Splitline chose the starting shape and computed it over the currently loaded rows without a provider request.
A partial Finder load is labeled Loaded prefix only. Visualize never claims to summarize an unseen file tail.
Open an agent suggestion
Use Analyze when you want an intent-rich plan such as “compare quality by task and split.” The model can propose only allow-listed fields, filters, aggregation, and view settings; Splitline computes the result locally.
A completed result does not steal the data stage or overwrite manual controls. Choose Open visualization when the file has no active view. When one exists, choose Review new suggestion and read the focused inline candidate. Choose Replace current visualization to accept it, or Keep current to remove the suggestion without changing your view. The warning states that manual chart settings will be discarded and that a replacement runs against the file’s current loaded rows.
The composer may include the current chart type and selected field names only when all of them are already inside the bounded profile list disclosed for that request. It never sends filters, title, selection, chart data, result rows, or field values through this chart context.
Refine the view
| Control | Meaning |
|---|---|
| View | Table, bar, line, scatter, histogram, or metric. |
| Group by / Horizontal field | The category or numeric field across the horizontal axis. |
| Measure / Vertical field | The numeric field aggregated or plotted vertically. |
| Aggregation | Count, sum, average, minimum, or maximum. |
| Split by | Up to seven most frequent series plus a separate remaining-series group. |
| Sort, Groups shown, Buckets | Contextual settings under More settings. |
Compatible fields remain selected when you change View. If the new view needs a different kind of field, Splitline keeps the incompatible choice visible, explains what is missing, and leaves the last valid chart on screen. It never silently substitutes another column.
Reset to local suggestion or Reset to agent plan restores source settings. When more than 12 groups are plotted, Narrow visible range, Previous range, and Next range provide a keyboard-operable closer view. Reset view restores hidden-series, visible-range, and pin state without changing the plan. Use current Rows scope composes the current Rows text search with the original analysis scope.
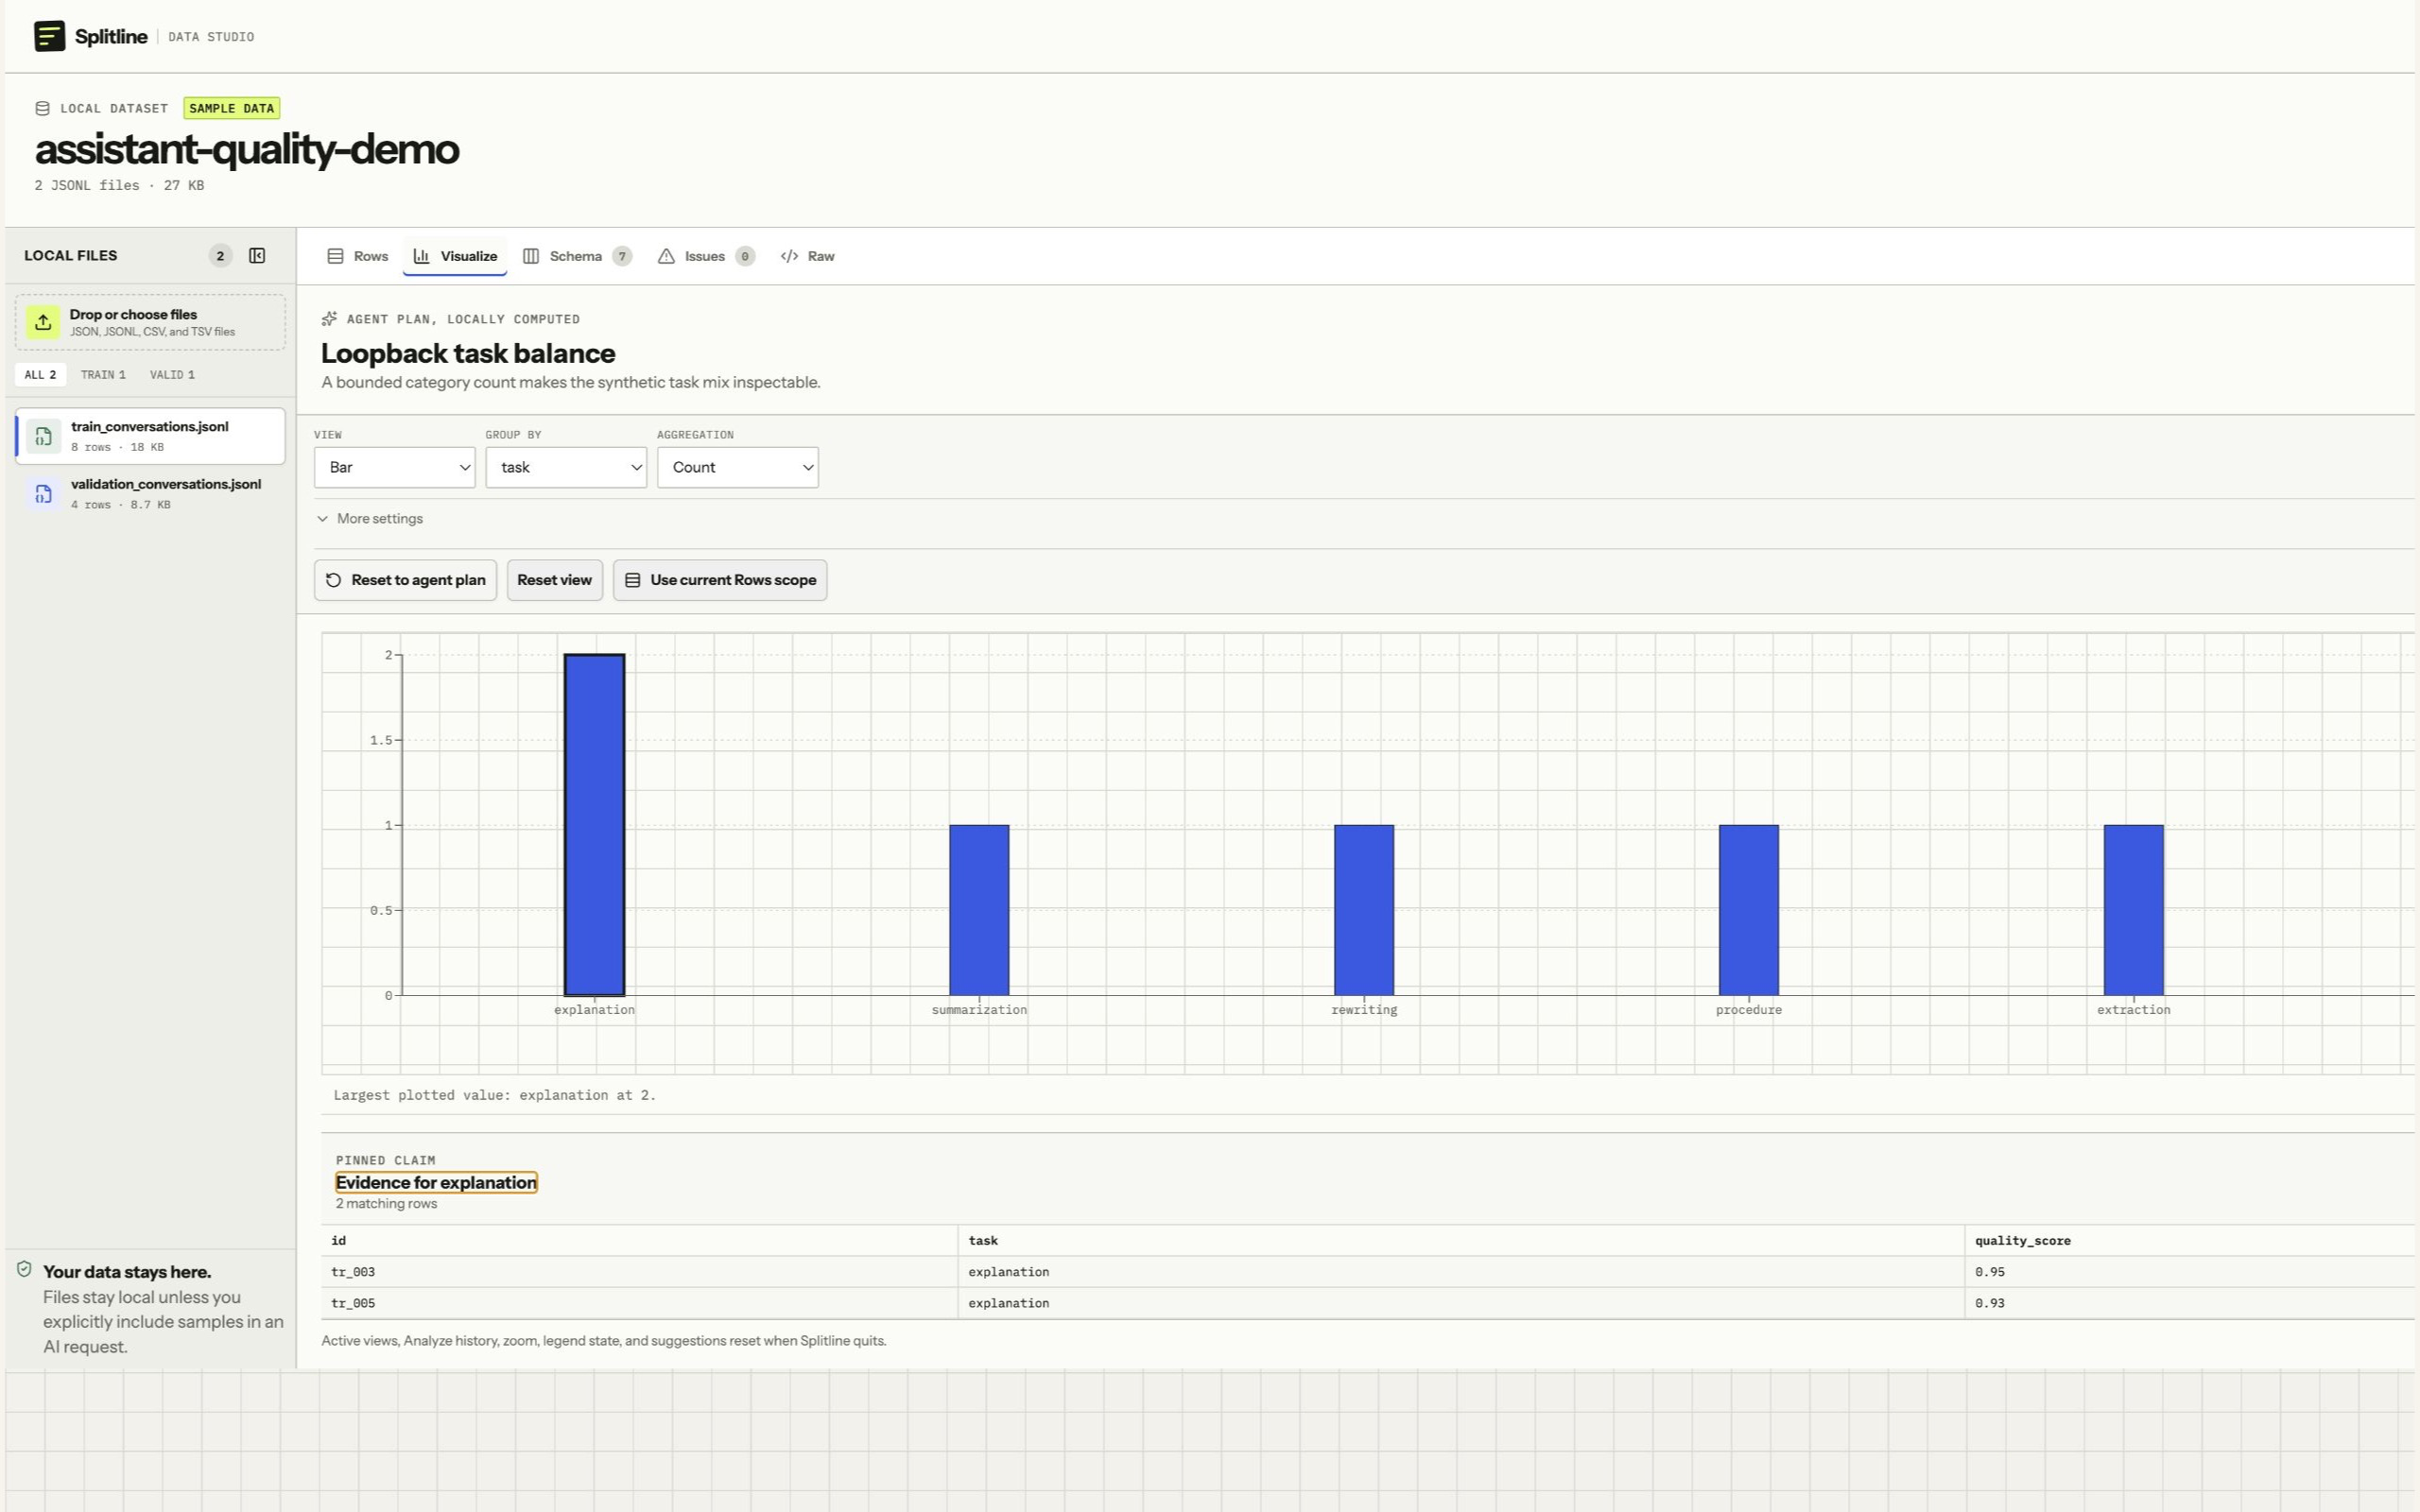
Pin and verify a claim
-
Pin one mark
Click a bar, line point, histogram bucket, or scatter point, or use the keyboard. Table and metric views expose their full analysis scope as one claim.
-
Inspect bounded evidence
Splitline rescans current rows with the exact typed category, series, numeric range, row index, or whole-analysis predicate. It counts every match but retains at most 50 evidence rows and stores no record array on the mark.
-
Choose Show matching rows
Rows opens with a removable From visualization chip. The original plan, selected mark, and existing Rows text search all apply. Back to visualization restores the selected chart without resetting legend or view state.
A committed edit, deletion, undo, or revert recomputes from current rows and clears the pin and linked Rows scope so an old row identity can never masquerade as current evidence.
Use the chart keyboard
In the full workspace the chart has one tab stop. Arrow keys move through visible marks; Home and End move to the first and last; Enter or Space pins the active mark. The external series legend uses ordinary buttons, and hidden-series marks leave keyboard navigation. Escape clears a focused pin while preserving higher modal or expanded surfaces.
Tooltips are supplementary. The chart also exposes a concise text summary and the evidence table, so hover is never the only way to read a result.
Understand limits and recovery
Visualize works over every record Splitline successfully loaded. Output is bounded to 100 x values or scatter points, 20 histogram buckets, eight series, and 50 evidence rows. A dense multi-series result is shown in labeled ranges of at most 200 marks at a time; use Previous range, Next range, and First range without changing the computed result. If more compatible scatter pairs exist, Splitline draws a deterministic sample across their source positions, sorts the retained points by the horizontal value, and states how many compatible pairs were not drawn. It stops recoverably above 50,000 distinct series values, 50,000 distinct group values, or 100,000 group-by-series cells. Choose a lower-cardinality field, apply the current Rows scope, or ask Analyze to narrow the plan.
Non-numeric values in a numeric measure are omitted and counted. Finite inputs that would produce an unrepresentable sum or range return a named diagnostic instead of passing infinity to the chart. Each diagnostic states the problem, cause, remedy, and a concrete action.
Know what resets
One active visualization and one pending suggestion are kept per open row file for the current launch. Switching files restores that file’s view. Closing Analyze preserves both. New session keeps active visualizations but clears unaccepted agent suggestions with the transcript.
Active views, manual settings, pending suggestions, pins, legend state, and visible ranges are never written to local storage or native configuration. Removing a file or quitting Splitline clears them. This memory-only boundary adds no quit blocker and no remote persistence.